Constant Pressure Addition - Thermodynamics
Thermodynamics Directory | Heat Transfer Directory
Constant Pressure Addition
Consider the plot on the Figure 7, T-V Diagram temperature-volume diagram of Figure 7, viewing the constant-pressure line that represents the states through which the water of the previous discussion passes as it is heated from the initial state of 14.7 psia and 60F. Let state A represent the initial state and state B represent the start of the saturated liquid line (212F). Therefore, line AB represents the process in which the liquid is heated from the initial temperature to the saturation temperature.
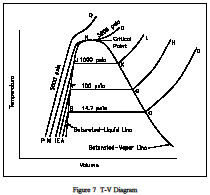
Point C is the saturated vapor state, and line BC is the constant-temperature process in which the change of phase from liquid to vapor occurs. Line CD represents the process in which the steam is super-heated at constant pressure. Temperature and volume both increase during the process. Now let the process take place at a constant pressure of 100 psia, beginning from an initial temperature of 60F. Point E represents the initial state, the specific volume being slightly less than 14.7 psia and 60F. Vaporization now begins at point F, where the temperature is 327.8F. Point G is the saturated-vapor state, and line GH is the constant-pressure process in which the steam is superheated.In a similar manner, a constant pressure of 1000 psia is represented by line IJKL, the saturation temperature being 544.6F.
Link to this Webpage:
© Copyright 2000 -
2024, by Engineers Edge, LLC
www.engineersedge.com
All rights reserved
Disclaimer |
Feedback
Advertising
| Contact