Enthalpy Entropy (h-s) or Mollier Diagram - Thermodynamics
Thermodynamics Directory | Heat Transfer Directory
Enthalpy Entropy (h-s) or Mollier Diagram
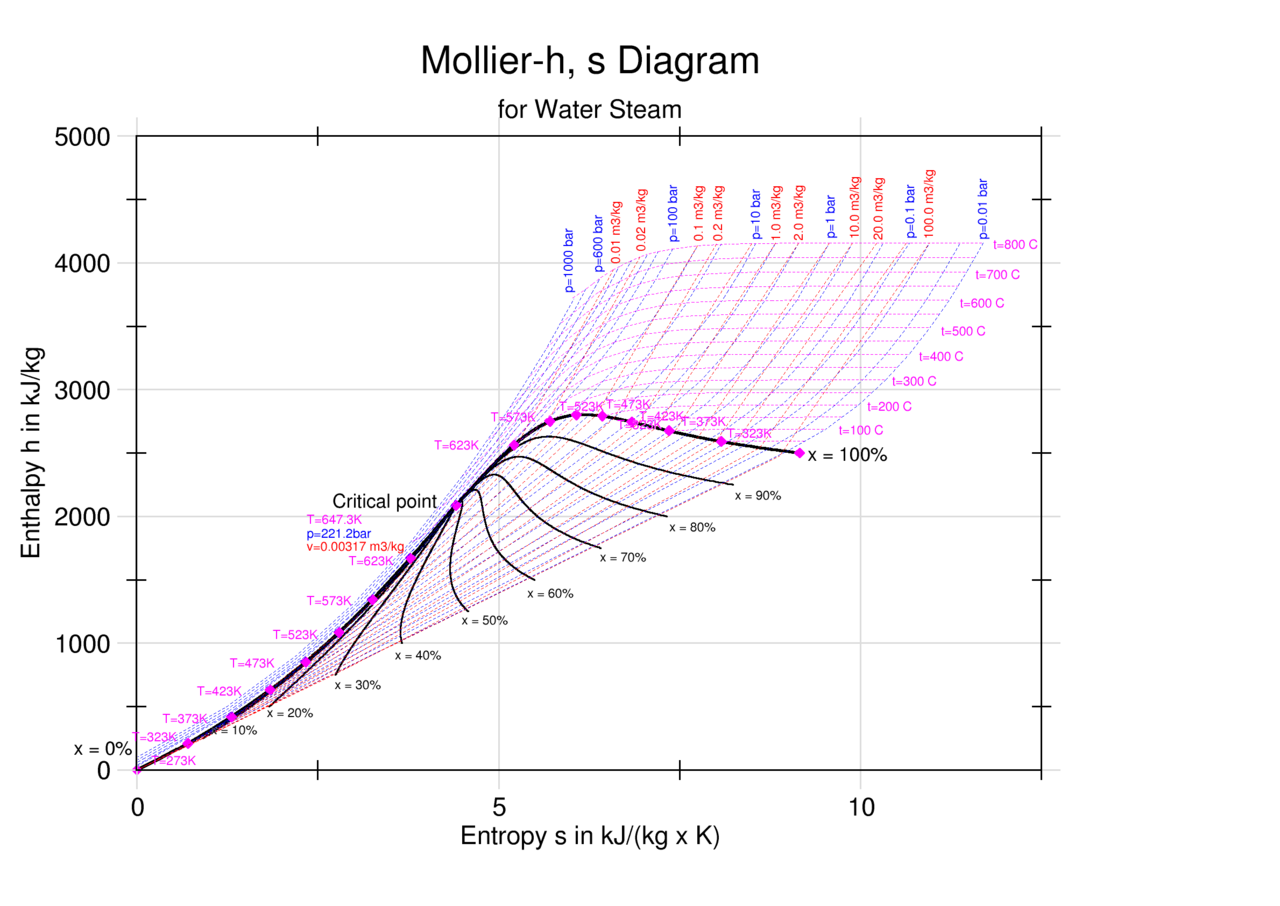
The Mollier diagram, shown in Figure A-1 , is a chart on which enthalpy (h) versus entropy (s) is plotted. It is sometimes known as the h-s diagram and has an entirely different shape from the T-s diagrams. The chart contains a series of constant temperature lines,a series of constant pressure lines, a series of constant moisture or quality lines, and a series of constant superheat lines. The Mollier diagram is used only when quality is greater than 50% and for superheated steam.
Click on the image below to enlarge
Link to this Webpage:
© Copyright 2000 -
2024, by Engineers Edge, LLC
www.engineersedge.com
All rights reserved
Disclaimer |
Feedback
Advertising
| Contact