Pressure Temperature (P-T) Diagram and Equation
Thermodynamics Directory | Heat Transfer Directory
Pressure Temperature (P-T) Diagram and Equation
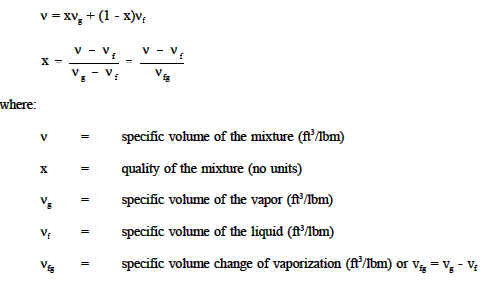
A P-T Diagram for Water type of property diagram. Figure 10 is the P- T diagram for pure water. A P-T diagram can be constructed for any pure substance. A P-T diagram is different from a P-T diagram in one particularly important way. There are regions on a P-n diagram in which two phases exist together. In the liquid-vapor region in Figure 10, water and steam exist together. For example, at point A, water with a specific volume (nf ), given by point B, exists together with steam with a specific volume (ng ), given by point C. The dotted lines on Figure 10 are lines of constant temperature. The quality of the mixture at any point in the liquid-vapor region can be found because the specific volumes of water, steam, and the mixture are all known. The quality can be found using the following relationship.
Link to this Webpage:
© Copyright 2000 -
2024, by Engineers Edge, LLC
www.engineersedge.com
All rights reserved
Disclaimer |
Feedback
Advertising
| Contact