Related Resources: calculators
Automation Investment Economic Analysis, Formulas and Calculator
Manufacturing Processes and Design
Automation and Manufacturing Investment Economic Analysis, Formulas and Calculator
Economic analyses for automation applications are similar to those for any manufacturing equipment purchase and usually use minimum annual revenue requirements, present value methods, or break-even analyses. Since robots are a flexible method of automation, a unique aspect of automations is manufacturing’s ability to reuse the robot after its initial production run for other applications in later years. For many companies, this subsequent use of the robot can be shown in the economic evaluation. Some other unique benefits in automation economic analysis that may be included are improved quality, higher precision, ability to run longer shifts, and reduced floor space. Unfortunately, some unique disadvantages of robot analysis are software integration complexity, inability to respond quickly to product design changes, and process reliability.
In general, there are several situations where robots are more likely to make economic sense. These are:
A. Sufficient volume to spread investment costs over many units
1. High volume
2. Stable product design
3. Multishift operations
B. Robot is used on more than one product
1. Limited number of different products on same production line
C. Part handling problems occur when performed manually
1. Parts that are very large, heavy, or bulky
2. Parts that are very fragile or easily damaged
3. Parts that are extremely small
D. Extremely difficult manufacturing process without using robot or automation
1. Many processes, especially in electronics, cannot be performed without robots or some type of
automation
E. Safety and health concerns of process
1. Safety and health costs can be significant
Investment costs:
- Robot purchase price — for many applications this is a much smaller part of the costs than expected (25 to 45%)
- Other equipment (part feeders, conveyors) — this includes the cost of hardware interfaces
- Design of end effector, special fixtures, and other equipment — most applications require the design of a unique end effector and special fixtures
- Software design and integration — can be a much higher cost than expected due to the complexity of interfacing different
equipment controllers
Installation including facility modifications — usually a small cost for robot system - Technical risk — this is the risk of whether the system will perform up to the specifications in areas such as performance, quality, precision, etc.
Operating costs
- Training — costs of training operators, engineering and maintenance personnel
- Product design changes — cost required to modify the automation software and hardware when design changes or
modifications are made to the product
Operating, utilities, and maintenance — typical costs found for most manufacturing equipment
Savings
- Direct labor — labor savings caused by the automation system
- Ergonomic and health — benefits of lower number of job injuries, workers compensation costs, and compliance with OSHA regulations
- Quality — improved quality may result due to lower scrap and waste
- Precision — robots can often perform tasks at a much higher precision (i.e., lower variability) than manual operations resulting in fewer defects and better product performance
Cost Justification for Robots
Preview: Automation and Manufacturing Investment Economic Analysis Calculator
Automation and Manufacturing Investment Economic Analysis Calculator (premium account login may be required)
In this section an example of a robot justification study is presented. This example uses the discounted cash flow method resulting in the calculation of a rate of return (often referred to as the internal rate of return).
The rate of return, R, is defined by Equation (1.0) as:
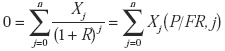
Equation 1.0)
Where
Xj = the net total cash flow for year j
n = number of years of cash flow
Basically, the rate of return, R, is the interest rate that makes the sum of the discounted cash flows equal zero.
The net cash flows, Xj, in Equation (1.0) can be defined by
Xj = ( G - C )j - ( G - C - D )j ( T ) - K + Lj
Equation (2.0):
Where
Gj = gross income (savings, revenues) for year j
Cj = the total costs for year j exclusive of book (company depreciation and debt interest)
Dj = tax depreciation for year j
T = tax rate (assumed constant)
K = total installed cost of the project (capital expenditure)
L = salvage value in year j
Modified Accelerated Cost Recovery System (MACRS)
The modified accelerated cost recovery system (MACRS) is a depreciation system used for tax purposes in the U.S. MACRS depreciation allows the capitalized cost of an asset to be recovered over a specified period via annual deductions. The MACRS system puts fixed assets into classes that have set depreciation periods.
Rate of Return
Minimum Acceptable (Attractive) Rate of Return (MARR)
The rate of return may be compared to a minimum acceptable (attractive) rate of return (MARR). If R ≥ MARR, the project is acceptable. Otherwise, it is unacceptable. It is pointed out that the definitions of cash flow and MARR are not independent.
MARR = ke ( 1 - c ) + kd ( 1 - T ) c
Equation (3.0):
Where:
ke = required return for equity capital
kd = required return for debt capital
T = tax rate
c = debt ratio of “pool of capital” used for current capital expenditures
In practice, it is not uncommon to adjust (increase) ke and kd for project risk and uncertainties in the economic climate. There are other definitions of cash flow definitions (equity and operating) with corresponding MARR definitions. A complete discussion of the relationship between cash flow and MARR definitions is given in Stevens (1994).
References:
Mechanical Engineering Handbook
Frank Kreith
1999
Related:
- Design for Manufacturing and Assembly
- Optimal Level of Automation in the Automotive Industry
- Workhead Mechanisms Part 6 , Automated Assembling
- Automation and Manufacturing | Automation and Manufacturing
- Robotics, Designing Mechanisms for Automated Machinery
- Handbook of Instruments Automation and Sensors
Link to this Webpage:
© Copyright 2000 -
2024, by Engineers Edge, LLC
www.engineersedge.com
All rights reserved
Disclaimer |
Feedback
Advertising
| Contact