Pressure Temperature (P-T) Diagram - Thermodynamics
Thermodynamics Directory | Heat Transfer Directory
Pressure Temperature (P-T) Diagram
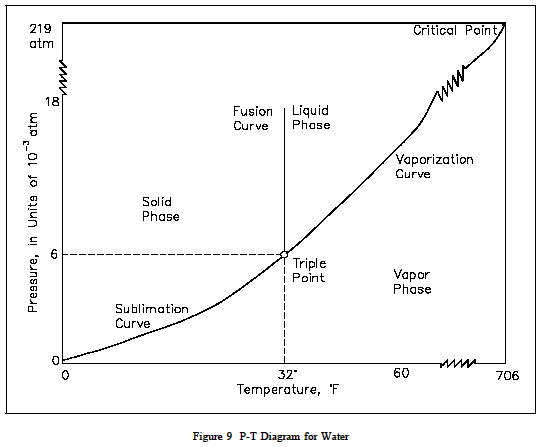
A P-T diagram is the most common way to show the phases of a substance. Figure 9 is the P-T diagram for pure water. A P-T diagram can be constructed for any puresubstance. The line that separates the solid and vapor phases is called the sublimation line.The line that separates the solid and liquid phases is called the fusion line. The line that separates the liquid and vapor phases is called the vaporization line.
The point where the three lines meet is called the triple point.The triple point is the only point at which all three phases can exist in equilibrium. The point where the vaporization line ends is called the critical point. At temperatures and pressures greater than those at the critical point, no substance can exist as aliquid no matter how great pressure is exerted upon it.
