Related Resources: thermodynamics
Psychrometric Analysis and Air Conditioning - Class 15
Thermodynamics Data, Equations, Charts, Equations and Calculators
Psychrometric Analysis and Air Conditioning - Class 15
Objective(s):
At the completion of the lecture, students should:
1) Understand that atmospheric air is a mixture of dry air and water vapor.
2) Recognize that water vapor in air can usually be treated as an ideal gas.
3) Understand what is meant by the term “absolute humidity” and be able to calculate it.
4) Understand what is meant by the term “relative humidity” and be able to calculate it.
5) Recognize how human comfort is associated with atmospheric moisture content.
6) Be able to analytically apply isobaric thermodynamic processes to atmospheric air to manipulate its moisture content.
7) Be able to graphically apply isobaric thermodynamic processes to atmospheric air to manipulate its moisture content using a psychrometric chart.
Methodology:
In-class lecture using whiteboard.
Terminology:
Dry air: Air comprised only of nitrogen, oxygen, and trace gases without any amount of water vapor in it.
Atmospheric air: A gas-vapor mixture comprised of dry air and water vapor.
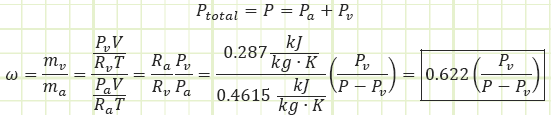
Partial pressure: Each species of gas in a mixture of gases exerts pressure in direct correlation to its molar concentration in the overall mixture. The sum of all the partial pressures will equal the total pressure of the mixture. Example: In dry air at sea level, 79% of the pressure we feel is due to the presence of nitrogen, which provides 80.05 kPa of partial pressure. Oxygen provides 21.18 kPa of partial pressure.
Vapor pressure: The partial pressure exerted by water vapor present in atmospheric air. For fully saturated air, it is equal to the saturation pressure, Pg, of water at the given temperature of the atmospheric air.
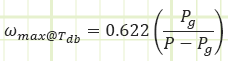
Specific humidity, ω: The actual moisture content of atmospheric air, given as the mass ratio of water vapor to dry air, i.e. [kg water/kg dry air or g water/kg dry air].
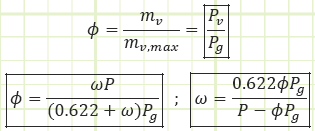
Relative humidity, Φ: The moisture content of atmospheric air, given as the ratio of the actual water vapor in the air to the maximum possible amount of water vapor that could be “held” by the air at a given temperature, i.e. atmospheric air at 0% RH has no water vapor in it, atmospheric air at 100% RH has as much water vapor as it can hold for a given temperature. Φ is equal to the actual vapor pressure divided by the saturated vapor pressure of water corresponding to the air’s temperature.
Dry bulb temperature: The temperature of atmospheric air as measured by a thermometer directly exposed to the air.
Wet bulb temperature: The temperature measured by a thermometer that is arranged to allow liquid water to evaporate off of it, causing its indicated temperature to be less than or equal to the dry bulb temperature. The lower the humidity of the atmospheric air, the lower the wet bulb temperature can be, due the higher cooling capacity permitted by the evaporation of liquid water. When the atmospheric air is saturated, the wet bulb temperature will be exactly equal to the dry bulb temperature.
Key Ideas:
Water in the air, analytical approach:
Depending on its temperature, air is able to have some amount of water vapor present in it as a gas-vapor mixture. The mass of water in each unit mass of dry air is termed “specific humidity.”

For the temperature range of interest, 0°C to 50°C, water vapor has relatively low partial pressure and can be treated as an ideal gas. As usual, air can also be treated as an ideal gas.
The maximum value Pv can be is the saturation pressure of water associated with the dry bulb temperature of the air. Table A-4 provides the values Pg in its second column. Pg = Psat@Tdb
Relative humidity provides a dimensionless parameter relating how much water vapor is in the air relative to how much could be in the air.
The enthalpy of atmospheric air is a combination of the enthalpy of the dry air and the enthalpy of the water vapor, both of which can be approximated as functions of solely temperature at the low pressures and temperature range of interest (because ideal gas!).


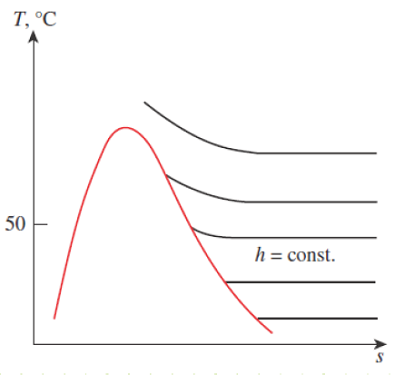
Figure 14-2
At temperature below 50 deg C, the h = contant lines coincide with the T = constant lines on the superheated vapor region of water
The dewpoint is a the dry bulb temperature at which moisture in the atmospheric air will begin to condense (when it’s cooled at constant pressure). It corresponds to the saturation temperature associated with a given vapor pressure.
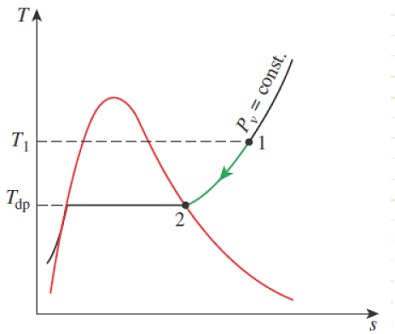
Figure 14-8
Constant-pressure cooling of moist air and the dew-point temperature on the T-s diagram of water.
When Pv = Pg, then θ=100% and Tdb = Tdp. This is when fog will begin to form. When moist air near the ground warms up, it becomes buoyant and rises (or it can be pushed upward by a mass of migrating colder air, a.k.a. a cold front). As the mass rises, its pressure decreases and it expands adiabatically, performing work on the surrounding atmosphere. The dry bulb temperature of the mass decreases due to this adiabatic expansion work. Eventually, the dry bulb temperature decreases all the way down to the dewpoint, at which time a cloud begins forming. If the moist air rises and cools enough, it can form raindrops, as the colder air can no longer hold its moisture.
Coast Guard cutters will log the dry and wet bulb temperatures on an hourly basis. This is a way of measuring the ambient humidity.

These two equations were derived from the mass & energy balances of the steady state control volume shown:

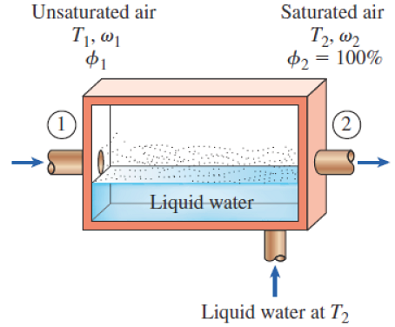
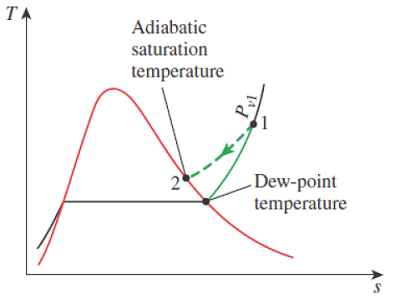
Figure 14-11
The adiabatic saturation process and its representation on a T-s diagram of water.
Mass balance to isolate mf

Energy balance to isolate ω1

Water in the air, graphical approach:
For quick numbers without a lot of calculations, the Psychrometric Chart exists. Each chart is limited to only one total pressure (usually 1 atm). It’s a way to quickly get all the qualitative and quantitative information you want and to see how the air’s properties change for simple air conditioning processes.


ASHRAE Psychrometric Chart No. 1
Source
Unknown Contributor - Reddit
Related:
- Introduction to Thermodynamics, Class 1
- Ideal Gas Assumptions, Properties of Pure Substances, Property Tables, Class 2
- Control Volume Analysis, Reynolds Transport Theorem, Conservation of Mass, and the First, Class 3
- Mechanical Work for Closed Systems Class 4
- Properties of Pure Substances , Phase Changes Class 5
- Thermodynamics of Multiphase Closed Systems Class 6
- Analysis of Open Systems Thermodynamics Class 7
- Introduction to Otto Cycle, Cycle Thermal Efficiency, Spark-Ignition Engine Architecture, and Combustion Cycle Class 8
- Closed System Cycles Ideal & Real Diesel Cycle Class 9
- Closed System Cycles Thermodynamics – Carnot Cycle & Entropy Class 10
- Steady Flow Gas Power Cycles – Brayton Cycle Class 11
- Steady Flow Vapor Power Cycles Thermodynamics – Rankine Cycle - Class 12
- Steady Flow Vapor Power Cycle – Rankine Cycle w/ Open Feedwater Heating - Class 13
- Steady Flow Vapor-Compression Refrigeration Cycle - Class 14
- FIRST LAW OF THERMODYNAMICS
- SECOND LAW OF THERMODYNAMICS
- Thermodynamic Systems and Surroundings
- Types of Thermodynamic Systems
- Thermodynamic Equilibrium
- Control Volume
- Steady State
- Thermodynamic Process
- Cyclic Process
- Reversible Process
- Irreversible Process
- Adiabatic Process
- Isentropic Process
- Polytropic Process
- Throttling Process
Link to this Webpage:
© Copyright 2000 -
2024, by Engineers Edge, LLC
www.engineersedge.com
All rights reserved
Disclaimer |
Feedback
Advertising
| Contact