Related Resources: thermodynamics
Thermodynamics of Multiphase Closed Systems Class 6
Thermodynamics Data, Equations, Charts, Equations and Calculators
Thermodynamics of Multiphase Closed Systems Class 06
Objective(s):
At the completion of the lecture, students should:
1) Be able to analyze a closed system containing a substance near or within the vapor dome.
Methodology:
Lecture with animations and video (Triple Point, Critical Point, tank car vacuum implosion).
Terminology:
Isochoric: A process in which volume of the system does not change.
Key Ideas:
To the Right of the Saturation Dome:
The substance is superheated for the values of temperature and pressure provided. Knowing any two intensive properties (including P and/or T) fixes the state and we know exactly where we are on the P-v-T surface.
Inside the Saturation Dome:
Knowledge of P and T is useful, but it’s not enough to fix the state, as the substance could be existing as either 100% saturated liquid with a small specific volume and lower internal energy, 100% saturated vapor with a large specific volume and higher internal energy, or anywhere in between as a saturated mixture. In addition to P and T, we need to know another intensive property. Specific volume of the mixture could work, or specific internal energy, or specific enthalpy. We introduce Quality as another saturation property that could also fix the state and can be calculated in many ways:

To find the extensive property for either phase existing in the mixture, multiply the amount of that phase by the specific property applicable to it. For example, to determine the total volume of saturated liquid in the mixture:

To determine how much of the system’s total internal energy is being stored within its vapor phase:
![]()
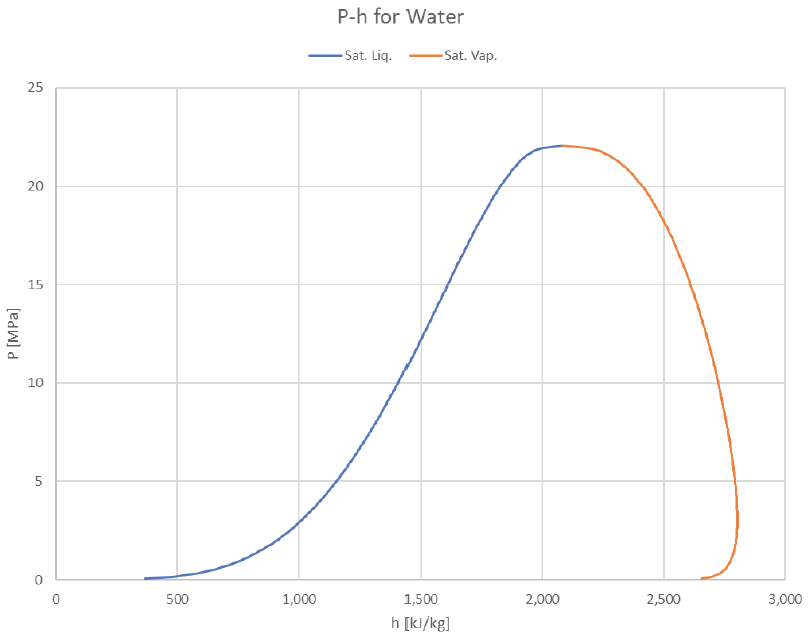
The vapor dome can be depicted in many ways. So far we’ve just look at P-v and T-v plots, but it’s common to plot T or P against other properties (usually h or s). Here are some examples of how it can look:

Note that the x-axis is depicted as logarithmic due to the extremely wide range of available specific volume. (liquids can expand A LOT when they boil, especially at lower temperatures and pressures).

It’s interesting to see that the internal energy of the saturated vapor actually peaks to its maximum value around 240°C and then drops to lower values at both higher or lower temperatures.

The T-h graph looks a lot like the T-u graph, with the right boundary pushed out a bit further (due to the larger contribution of Pv that vapor offers).

The Temperature-Entropy plot provides a fairly symmetrical shape not too unlike a standard bell curve. Given that entropy is actually a probabilistically-derived property, perhaps this similarity is more than just a coincidence?
Looking at the same graphs indexed for pressure instead of temperature:


To the left of the Saturation Dome:
The substance exists as a subcooled liquid, which is also called a compressed liquid. It can also exist as a solid and there’s a sublimation table for ice-to-vapor in the textbook’s appendix, which is really just an extension of the vapor dome at temperatures and pressures lower than where water can even exist as a liquid.
There are some tables provided for compressed liquid water, but they’re not nearly as detailed as the saturation and superheated tables. This is because the properties of a subcooled liquid depend MUCH more strongly on temperature than pressure. It take A LOT of pressure to influence the specific volume, internal energy, entropy, or even enthalpy, but it doesn’t take much of a temperature change at all to cause a larger effect.
So here’s a trick: If you’re dealing with a substance in the subcooled liquid phase and pressure is fairly modest (like, under 5 MPa), you can get away with just using the saturated liquid values for whichever property you need. So even if you have liquid water at 10°C sitting in a room with ambient pressure of 1 atm, go to the saturation table (A-4 in this case) and just use the values of vf, uf, hf, and sf that are applicable for saturated liquid water at 10°C (just ignore the Psat column).
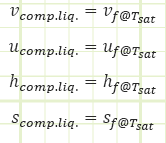
If you want to be REALLY rigorous, instead of using the listed value of hf, use the listed value of uf and add the product of the actual pressure (101.325 kPa(a) in the example above) and the listed value of vf.

Source
Unknown Contributor - Reddit
Related:
- Introduction to Thermodynamics, Class 1
- Ideal Gas Assumptions, Properties of Pure Substances, Property Tables, Class 2
- Control Volume Analysis, Reynolds Transport Theorem, Conservation of Mass, and the First, Class 3
- Mechanical Work for Closed Systems Class 4
- Properties of Pure Substances , Phase Changes Class 5
- FIRST LAW OF THERMODYNAMICS
- SECOND LAW OF THERMODYNAMICS
- Thermodynamic Systems and Surroundings
- Types of Thermodynamic Systems
- Thermodynamic Equilibrium
- Control Volume
- Steady State
- Thermodynamic Process
- Cyclic Process
- Reversible Process
- Irreversible Process
- Adiabatic Process
- Isentropic Process
- Polytropic Process
- Throttling Process
Link to this Webpage:
© Copyright 2000 -
2024, by Engineers Edge, LLC
www.engineersedge.com
All rights reserved
Disclaimer |
Feedback
Advertising
| Contact