Related Resources: materials
Fatigue Design Curves and Analysis for Aluminum
Strength and Mechanics of Materials Menu
Engineering Material Specifications Characteristics Ferrous Non-Ferrous Metals
Fatigue Design Curves and Analysis for Aluminum
Fatigue data on 6061-T6 aluminum were collected from the literature (Structural Alloys Handbook, 1989; Alcoa Structural Handbook, 1960; MIL-HDBK-SD, 1984; AFML-TDR- 64-280, 1970; Brodrick and Spiering, 1972) to construct a design fatigue curve. The data are plotted in Fig. 1. Data for test temperatures from room temperature up to 149°C (300°F) are included. The data are for fully reversed loading. The low cycle data (l03 cycles) are all from axial strain controlled tests. Note that the data from the strain controlled tests fall right in with the rest of the data at greater than l03 cycles. Some of the high cycle data are from rotating beam tests. A fit to the 6061-T6 fatigue data was developed using the equation given in the Code Section III criteria document (1969).
Eq. 1
S = E / ( 4 · N0.5 ) ln [ 100 / ( 100 - A ) ] + B
and A and B are constants that are selected to make the equation fit the data. Note that S is treated like a stress based on the assumption of elastic behavior. However, it does not represent a real stress when the elastic range is exceeded. As a first approximation, the fatigue properties can be estimated by taking A as the percentage reduction of area in a tensile test, RA, and B as the endurance limit Se It should be noted that aluminum does not exhibit an endurance limit. The fit to the data is
Eq. 2
S = 14,479 / N0.5 + 96.5 MPa
or
Eq. 3
S = 2,100,000 / N0.5 + 14,000 psi
The curve is shown with the available data from tests without any mean stress in Fig. 1. It was used to construct the design curve by reducing the stress by a factor of two or the number of cycles to failure by twenty as shown in Fig. 2. The design curve is truncated at twice the yield strength to prevent significant strain accumulation.
Mean Stress Effects
Data from fatigue tests (Structural Alloys Handbook, 1989; MIL-HDBK-SD, 1984) with an applied mean stress fall below the fit to the fully reversed fatigue data as shown in Fig. 3. The mean stress data include test series with constant R ratios as high as +0.5 and test series with applied mean stress of up to 207 MPa (30 ksi). Mean stress effects are generally accounted for by use of the modified Goodman diagram (ASME Criteria Document, 1969) when the fatigue curves in the ASME Boiler and Pressure Vessel Code are developed. Experimental studies of aluminum (Fuchs and Stephens, 1980; Woodward, et al., 1956) show that the mean stress effect is better described by the Gerber equation
Sf ' = Sf (1 - Sm / Su )
Where:
Sf ' = fatigue strength in presence of mean stress
Sf = fatigue strength under fully reversed cycling
Sm = mean stress
Su = tensile strength.
The modified Goodman diagram is generally used because it is simpler to apply than the Gerber equation and is more conservative. However, for materials that have a high yield strength to tensile strength ratio, such as 6061-T6 aluminum or high strength steel bolts, the modified Goodman approach tends to become overly conservative. The mean stress effect in high strength bolts was accounted for using the Peterson cubic equation when the Code fatigue curves were developed (Snow and Langer, 1967).
The Gerber equation and the linear Goodman equation are represented in Fig. 4. The alternating stress is represented on the ordinate and the mean stress is represented on the abscissa. The straight solid line drawn from the fatigue strength for fully reversed loading for 200,000 cycles [129 MPa (18.7 ksi)] to the tensile strength [290 MPa (42 ksi)] is a graphical representation of the Goodman prediction of the effect of mean stress. The Gerber prediction is the curved line. The dashed line drawn between the cyclic yield stress [262 MPa (38 ksi)] on both axes represents the boundary of sustained cyclic conditions; yielding will occur if the combination of alternating stress and mean stress is above the dashed line. Therefore, the intersection of the dashed line with the Goodman or Gerber line gives the maximum effect of mean stress because yielding would reduce any higher mean stress. For the case of 200,000 cycles shown in Fig. 4, the Goodman approach would predict a maximum reduction in fatigue strength to [22 MPa (3.2 ksi)]. Using the Gerber approach, the maximum reduction is to [75 MPa (10.94 ksi)]. For this case, the allowable alternating stress is increased by three times because the Gerber approach was used instead of the Goodman approach.
The difference between the maximum mean stress effect predicted by the Gerber and Goodman approaches becomes much more significant when the yield strength approaches the tensile strength, especially for low fatigue strengths.
Studies by Brodrick and Stephens (1972); and Chung and Abel, (1988) have shown that 6061-T6 cyclically hardens a small amount at room temperature [typically 241 MPa (35 ksi) to 262 MPa (38 ksi)]. At 149OC (300OF) it cyclically softens at total strain ranges below about two percent and cyclically hardens at higher total strain ranges.
Because 6061-T6 aluminum cyclically hardens, a value of 262 MPa (38 ksi) was used for the yield strength when determining the maximum effect of mean stress. This d0 Es result in lower values of allowable alternating stress than would have been obtained if the monotomic yield strength of 241 MPa (35 ksi) had been used. For example, the maximum mean stress reduction in the 200,000 cycle fatigue strength would have been to 93 MPa (13.5 ksi) instead of to 75 MPa (10.94 ksi).]
Yield and ultimate strengths of 262 MPa (38 ksi) and 290 MPa (42 ksi), respectively, were used in making the mean stress corrections to the best fit to the fatigue data. The resulting curve shown in Fig. 5 was then reduced by a factor of two on stress or twenty on number of cycles to failure to arrive at a design curve that considers the effects of the maximum amount of mean stress that could be sustained.
The design curves with zero mean stress and with maximum mean stress are shown in Fig. 6. The design curves are both truncated at twice the minimum yield strength to help guard against excessive strain. Tabular values of allowable alternating stress are given in Table 1.
FATIGUE OF WELDED 6061-T6 ALUMINUM
The fatigue behavior of aluminum alloy weldments has been surveyed by Sanders (1971), Sanders and Lawrence (1978), and Sanders and Day (1983). Weldment fatigue data for 6061-T6 aluminum from Sanders and Day (1983) are compared with the design fatigue curves with no mean stress effect and with maximum mean stress effect in Fig. 7. This comparison seems to indicate that the design curve with maximum mean stress effect would be adequate for weldments.
Considerable testing on transverse butt joints in 9.5 mm (3/8 in.) thick 6061-T6 aluminum plate welded by the inert-gas tungsten-arc process using 4043 electrodes was reported by Hartmann, et al. (1954). The gage section was 139.7 mm (5.0 in.) wide and 393.7 mm (15.5 in.) long. The tests were conducted in Alcoa’s Aluminum Research Laboratories’ Structural Fatigue Testing Machines which loaded the specimens axially with a tensile stress range from zero to a maximum stress (R=O). In general, the fatigue specimens with the weld bead left in the as-welded condition failed at the edge of the bead; however, a few specimens with very smooth weld bead failed in the heat-affected zone. The majority of the fatigue failures in specimens - in which the weld bead was removed occurred in the heataffected zone with about 20 percent of the failures occumng through the weld. Nordmark and Clark (1964) extended those tests to include a number of different stress ratios. Comparison of data from Nordmark and Clark (1964) with the design curves in Fig. 8 shows that the design curve with maximum mean stress effects is not adequate for weldments subjected to cycles with high mean stress.
It should be noted that fatigue allowables for welded 6061-T6 aluminum are included in specifications suggested by the American Society of Civil Engineers (ASCE) Task Committee on Lightweight Alloys (1962). The fatigue allowables in the ASCE specification were based on the data from Nordmark and Clark (1964). The ASCE design curves are compared with the proposed design fatigue curves in Fig. 9. Note that the ASCE fatigue design curve for welded joints with an R-ratio of 0.5 is in good agreement with the design curve with maximum mean stress effects and a weld reduction factor of two. Therefore, a weld reduction factor of two must be applied to the fatigue design curves when they are applied to welds.
The fatigue design curve reduced by a factor of two on stress is compared with the data fiom Sanders and Day (1983) and Nordmark and Clark (1964) for weldments in Fig. 10. The open point symbols are from tests with no mean stress. The plus and x symbols are from tests with applied mean stress. As can be seen in Fig. 10, a weld reduction factor of two, i.e. dividing the allowable stress values by two, results in design curves that are adequately conservative.
SUMMARY
Fatigue design curves have been developed for 6061-T6 aluminum and are given in Fig. 6
and Table 1. Mean stress effects were accounted for using the Gerber equation. A weld
reduction factor of two is required when the fatigue design curves are applied to welds.
ACKNOWLEDGMENTS
C. R. Luttrell’s assistance in assembling the database is appreciated. Members of the
ASME Boiler and Pressure Vessel Committee’s Subgroup on Fatigue Strength chaired by
W. J. O’Donnell provided many helpful suggestions and valuable guidance. Reviews by
C. R. Brinkman, R. C. Gwaltney, and D. P. Jones are gratefully acknowledged. I thank
Sherry Byerly for typing the manuscript. The support of this work by J. M. Corum, D. L.
Selby, and C. D. West is gratefully acknowledged.
Where:
A = constant
B = constant
E = eleastic modulus
N = number of cycles to failure
S = strain amplitube times elastic modulus
R = ratio of minimum stress to maximum stress in a fatigue test
RA = percent reduction of area
S = strain amplitude of alternating stress intensity
Sa = allowable amplitutde times eleastic modulus
Se = endurance limit
Sf = fatigue strength under fully reveresd loading
Sf1 = fatigue strength in presense of mean stress
Sm = mean stree
Su = tensile strength
Sy = cyclic yield strength
Table 1 Tabulated values of Sa from Fig. 6.
Number of Cycles |
Sa |
|||
Zero mean stress |
Maximum mean stress |
|||
(MPa) |
(ksi) |
(MPa) |
(ksi) |
|
1.0 E+01 |
482.63 |
70.00 |
482.63 |
70.00 |
2.0 E+0 1 |
482.63 |
70.00 |
482.63 |
70.00 |
5.0 E+01 |
482.63 |
70.00 |
482.63 |
70.00 |
7.0 E+01 |
482.63 |
70.00 |
482.63 |
70.00 |
1.0 E+02 |
420.28 |
60.96 |
420.28 |
60.96 |
2.0 E+02 |
325.43 |
47.20 |
325.43 |
47.20 |
5.0 E+02 |
241.32 |
35.00 |
239.94 |
34.80 |
1.0 E+03 |
198.91 |
28.85 |
184.71 |
26.79 |
2.0 E+03 |
168.92 |
24.50 |
137.89 |
20.00 |
5.0 E+03 |
142.31 |
20.64 |
95.01 |
13.78 |
7.0 E+03 |
135.83 |
19.70 |
75.36 |
10.93 |
1.0 E+04 |
120.66 |
17.50 |
63.02 |
9.14 |
2.0 E+04 |
99.46 |
14.43 |
53.37 |
7.74 |
5.0 E+04 |
80.64 |
1 1.70 |
49.50 |
7.18 |
1 .0 E+05 |
71.15 |
10.32 |
47.50 |
6.89 |
2.0 E+05 |
64.45 |
9.35 |
37.68 |
5.47 |
5.0 E-tO5 |
58.50 |
8.49 |
30.06 |
4.36 |
1.0 E+06 |
55.50 |
8.05 |
26.68 |
3.87 |
2.0 E+06 |
53.38 |
7.74 |
24.48 |
3.55 |
5.0 E+06 |
51.50 |
7.47 |
22.68 |
3.29 |
1.0 E+07 |
50.55 |
7.33 |
21.79 |
3.16 |
2.0 E+07 |
49.88 |
7.24 |
21.1 8 |
3.07 |
5.0 E+07 |
49.28 |
7.15 |
20.66 |
3.00 |
1.0 E+08 |
48.99 |
7.11 |
20.39 |
2.96 |
2.0 E+08 |
48.77 |
7.07 |
20.21 |
2.93 |
5.0 E+08 |
48.59 |
7.05 |
20.06 |
2.91 |
1.0 E+09 |
48.49 |
7.03 |
19.97 |
2.90 |
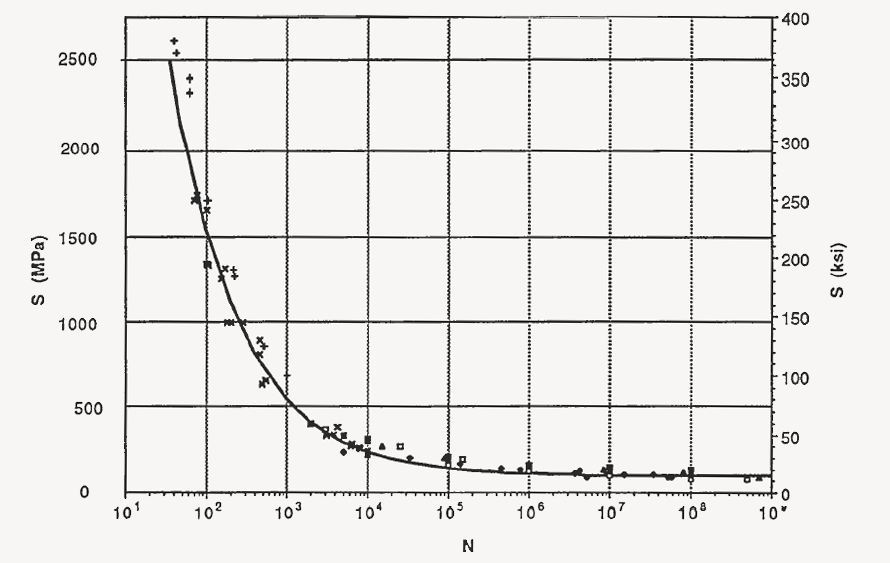
Fig. 1 Fit to fully reversed 6061-T6 fatigue data.
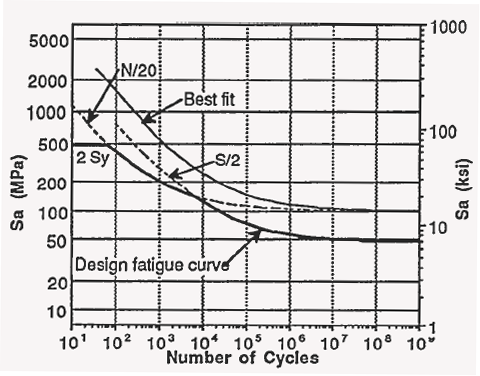
Fig. 2. Design fatigue curve is constructed by reducing fit
to data by factor of 20 on life and 2 on stress.

Fig. 3. Fatigue test data from tests with applied mear
stress fall below fit to fully reversed fatigue data.

Fig. 4. Comparison of Gerber and Goodman mean
stress corrections at 200,000 cycles.

Fig. 5 Gerber mean stress correction provides lower
bound to data from tests with mean stress.

Fig. 6. Fatigue design curves for 6061-T6 aluminum.

Fig. 7. Weldment fatigue data for 6061-T6 aluminum.

Fig. 8. Data from fatigue tests on weldments with applied
mean stress compared with design fatigue curves

Fig. 9. Proposed fatigue curves compared with
ASCE fatigue allowables.

Fig. 10. Proposed fatigue-design curves fall well below
data when weld reduction factor of two is applied.
Source:
G. T. Yahr
Engineering Technology Division
Oak Ridge National Laboratory
Oak Ridge, Tennessee
Related:
- Aluminum
- Modes of Fatigue Failure
- Fatigue Crack Growth Analysis Review
- Fatigue and Maximum Shear Stress Theory Equations and Calculator
- Fatigue - Strength ( Mechanics ) of Materials
- Fatigue and Machine Design Excel Spreadsheet Calculator
- Soderberg Method Fatigue Curve Equation
- Metal Fatigue Engineering Analysis Excel Spreadsheet Calculator
- Aluminum Cast and Wrough Engineering Specifications
- Hard Chromic Anodize Anodizing Finish Plating
- Structural Shapes Steel, Aluminum ASTM, BS, EN, ISO Sizes Tables
- Aluminum Tempers, specifications and designations
- ASTM Aluminum Structural Shape Angle Equal Leg Table
- Aluminum Alloys Temper designation and subdivisions
- Marin Endurance Limit Equations and Calculator
- Fatigue Design Based on S-N Data
Link to this Webpage:
© Copyright 2000 -
2024, by Engineers Edge, LLC
www.engineersedge.com
All rights reserved
Disclaimer |
Feedback
Advertising
| Contact